Plot a stratigraphic map
import all required packages
[17]:
%load_ext autoreload
%autoreload 2
from mplStrater.data import StrataFrame
from mplStrater import StratigraphicMap
from mplStrater.strata import Legend

import pandas as pd
The autoreload extension is already loaded. To reload it, use:
  %reload_ext autoreload
At the moment, the example requires a temporary hardcode from the original script that inspired the package.
[18]:
import json
with open("../../../data/label_hardcoding.json","r") as f:
    label_hardcoding=json.load(f)
label_hardcoding
[18]:
{'TI03': {'side': 'right', 'movetext': {'0': '-0.35', '2': '0.3'}},
 'TI04': {'side': 'right', 'movetext': {}},
 'TI05': {'side': 'right', 'movetext': {'-1': '0.4', '-2': '0.4'}},
 'TI06': {'side': 'right',
  'movetext': {'0': '-0.2', '-2': '0.3', '-1': '0.2'}},
 'TI07': {'side': '', 'movetext': {'0': '-0.1', '-1': '0.1'}},
 'TI08': {'side': 'right', 'movetext': {'-2': '0.3', '-1': '0.3'}},
 'TI09': {'side': 'right', 'movetext': {'0': '-0.3'}},
 'TI10': {'side': 'right', 'movetext': {'0': '-0.2', '1': '0.3'}},
 'TI11': {'side': 'right', 'movetext': {'-2': '0.2', '-1': '0.3'}},
 'TI12': {'side': 'right', 'movetext': {}},
 'TI13': {'side': 'right', 'movetext': {}},
 'SI02': {'side': 'right', 'movetext': {}},
 'SI04': {'side': 'right', 'movetext': {}},
 'SI07': {'side': 'right', 'movetext': {}}}
Load data
Load the example data and initiate a StrataFrame by proving the example df and specify its epsg code.
[19]:
df=pd.read_csv("../../../data/example.csv")
df.head()
[19]:
| x | y | ID | from | to | fill | hatch | lbl1 | lbl2 | lbl3 | |
|---|---|---|---|---|---|---|---|---|---|---|
| 0 | 204026.93 | 4973197.522 | SI01 | 0.0 | 0.6 | Riporto conforme | _ | _ | _ | -1 |
| 1 | 204026.93 | 4973197.522 | SI01 | 0.6 | 2.0 | Assenza campione | _ | _ | _ | -1 |
| 2 | 204026.93 | 4973197.522 | SI01 | 2.0 | 3.5 | Rifiuto | Pericoloso | IA | non rilevato | -1 |
| 3 | 204026.93 | 4973197.522 | SI01 | 3.5 | 5.2 | Assenza campione | _ | _ | _ | -1 |
| 4 | 204026.93 | 4973197.522 | SI01 | 5.2 | 6.2 | Rifiuto | Pericoloso | NP | non rilevato | -1 |
[20]:
sf=StrataFrame(
    df=df,
    epsg=32633)
sf.strataframe.head()
[20]:
| ID | x | y | fill_list | layers | hatch_list | lbl1_list | lbl2_list | lbl3_list | scale | geometry | |
|---|---|---|---|---|---|---|---|---|---|---|---|
| 0 | SI01 | 204026.930 | 4973197.522 | [Riporto conforme, Assenza campione, Rifiuto, ... | [0.0, 0.6, 2.0, 3.5, 5.2, 6.2, 8.0, 9.0, 10.0] | [_, _, Pericoloso, _, Pericoloso, _, _, _, _] | [_, _, IA, _, NP, _, _, _, _] | [_, _, non rilevato, _, non rilevato, _, _, _, _] | [-1, -1, -1, -1, -1, -1, -1, -1, -1] | 10.0 | POINT (204026.930 4973197.522) |
| 1 | SI02 | 204008.591 | 4973148.940 | [Riporto non conforme, Assenza campione, Rifiu... | [0.0, 2.0, 3.0, 6.0, 6.6, 8.5] | [Non pericoloso, _, Non pericoloso, _, Non per... | [NP, _, NP, _, NP, NP] | [non rilevato, _, non rilevato, _, non rilevat... | [-1, -1, -1, -1, -1, -1] | 8.5 | POINT (204008.591 4973148.940) |
| 2 | SI03 | 204008.734 | 4973122.605 | [Assenza campione, Riporto non conforme, Assen... | [0.0, 1.5, 3.4, 5.0, 6.0, 8.4, 8.5, 9.0] | [_, Non pericoloso, _, Non pericoloso, Non per... | [_, NP, _, NP, NP, _, _, _] | [_, non rilevato, _, non rilevato, non rilevat... | [-1, -1, -1, -1, -1, -1, -1, -1] | 9.0 | POINT (204008.734 4973122.605) |
| 3 | SI04 | 204067.328 | 4973124.151 | [Riporto non conforme, Assenza campione, Ripor... | [0.0, 1.5, 4.0, 5.5, 6.0, 7.6, 8.0] | [Non pericoloso, _, Non pericoloso, _, Pericol... | [NP, _, NP, _, P, _, _] | [non rilevato, _, non rilevato, _, non rilevat... | [-1, -1, -1, -1, -1, -1, -1] | 8.0 | POINT (204067.328 4973124.151) |
| 4 | SI05 | 204034.262 | 4973098.016 | [Riporto non conforme, Assenza campione, Ripor... | [0.0, 2.6, 4.2, 5.8, 7.6, 8.0] | [Non pericoloso, _, Non pericoloso, Non perico... | [NP, _, NP, NP, _, _] | [non rilevato, _, non rilevato, non rilevato, ... | [-1, -1, -1, -1, -1, -1] | 8.0 | POINT (204034.262 4973098.016) |
Initiate a StratigraphicMap
Create a stratigraphic map, providing the StrataFrame object previously loaded.
Addittionally it is possible to specify further parameters, such as * the path basemap_path to the basemap * fig_kwd : keywords to set figure proprieties * label_hardcode : load hardcoding dictionary
[21]:
map=StratigraphicMap(
   sf,
   "../../../data/ortofoto.tif",
   fig_kwd={"figsize":(16,12),"dpi":(300)},
   label_hardcoding=label_hardcoding
)
Define a Legend
Define legend.
[22]:
fill_dict={
    'Terreno conforme': 'lightgreen',
    'Riporto conforme': 'darkgreen',
    'Riporto non conforme': 'orange',
    'Rifiuto': 'red',
    'Assenza campione': 'white'
    }

hatch_dict={
    'Non pericoloso': '',
    'Pericoloso': 'xxxxxxxxx',
    '_': ''
    }
[23]:
legend=Legend(
    fill_dict=fill_dict,
    hatch_dict=hatch_dict
    )
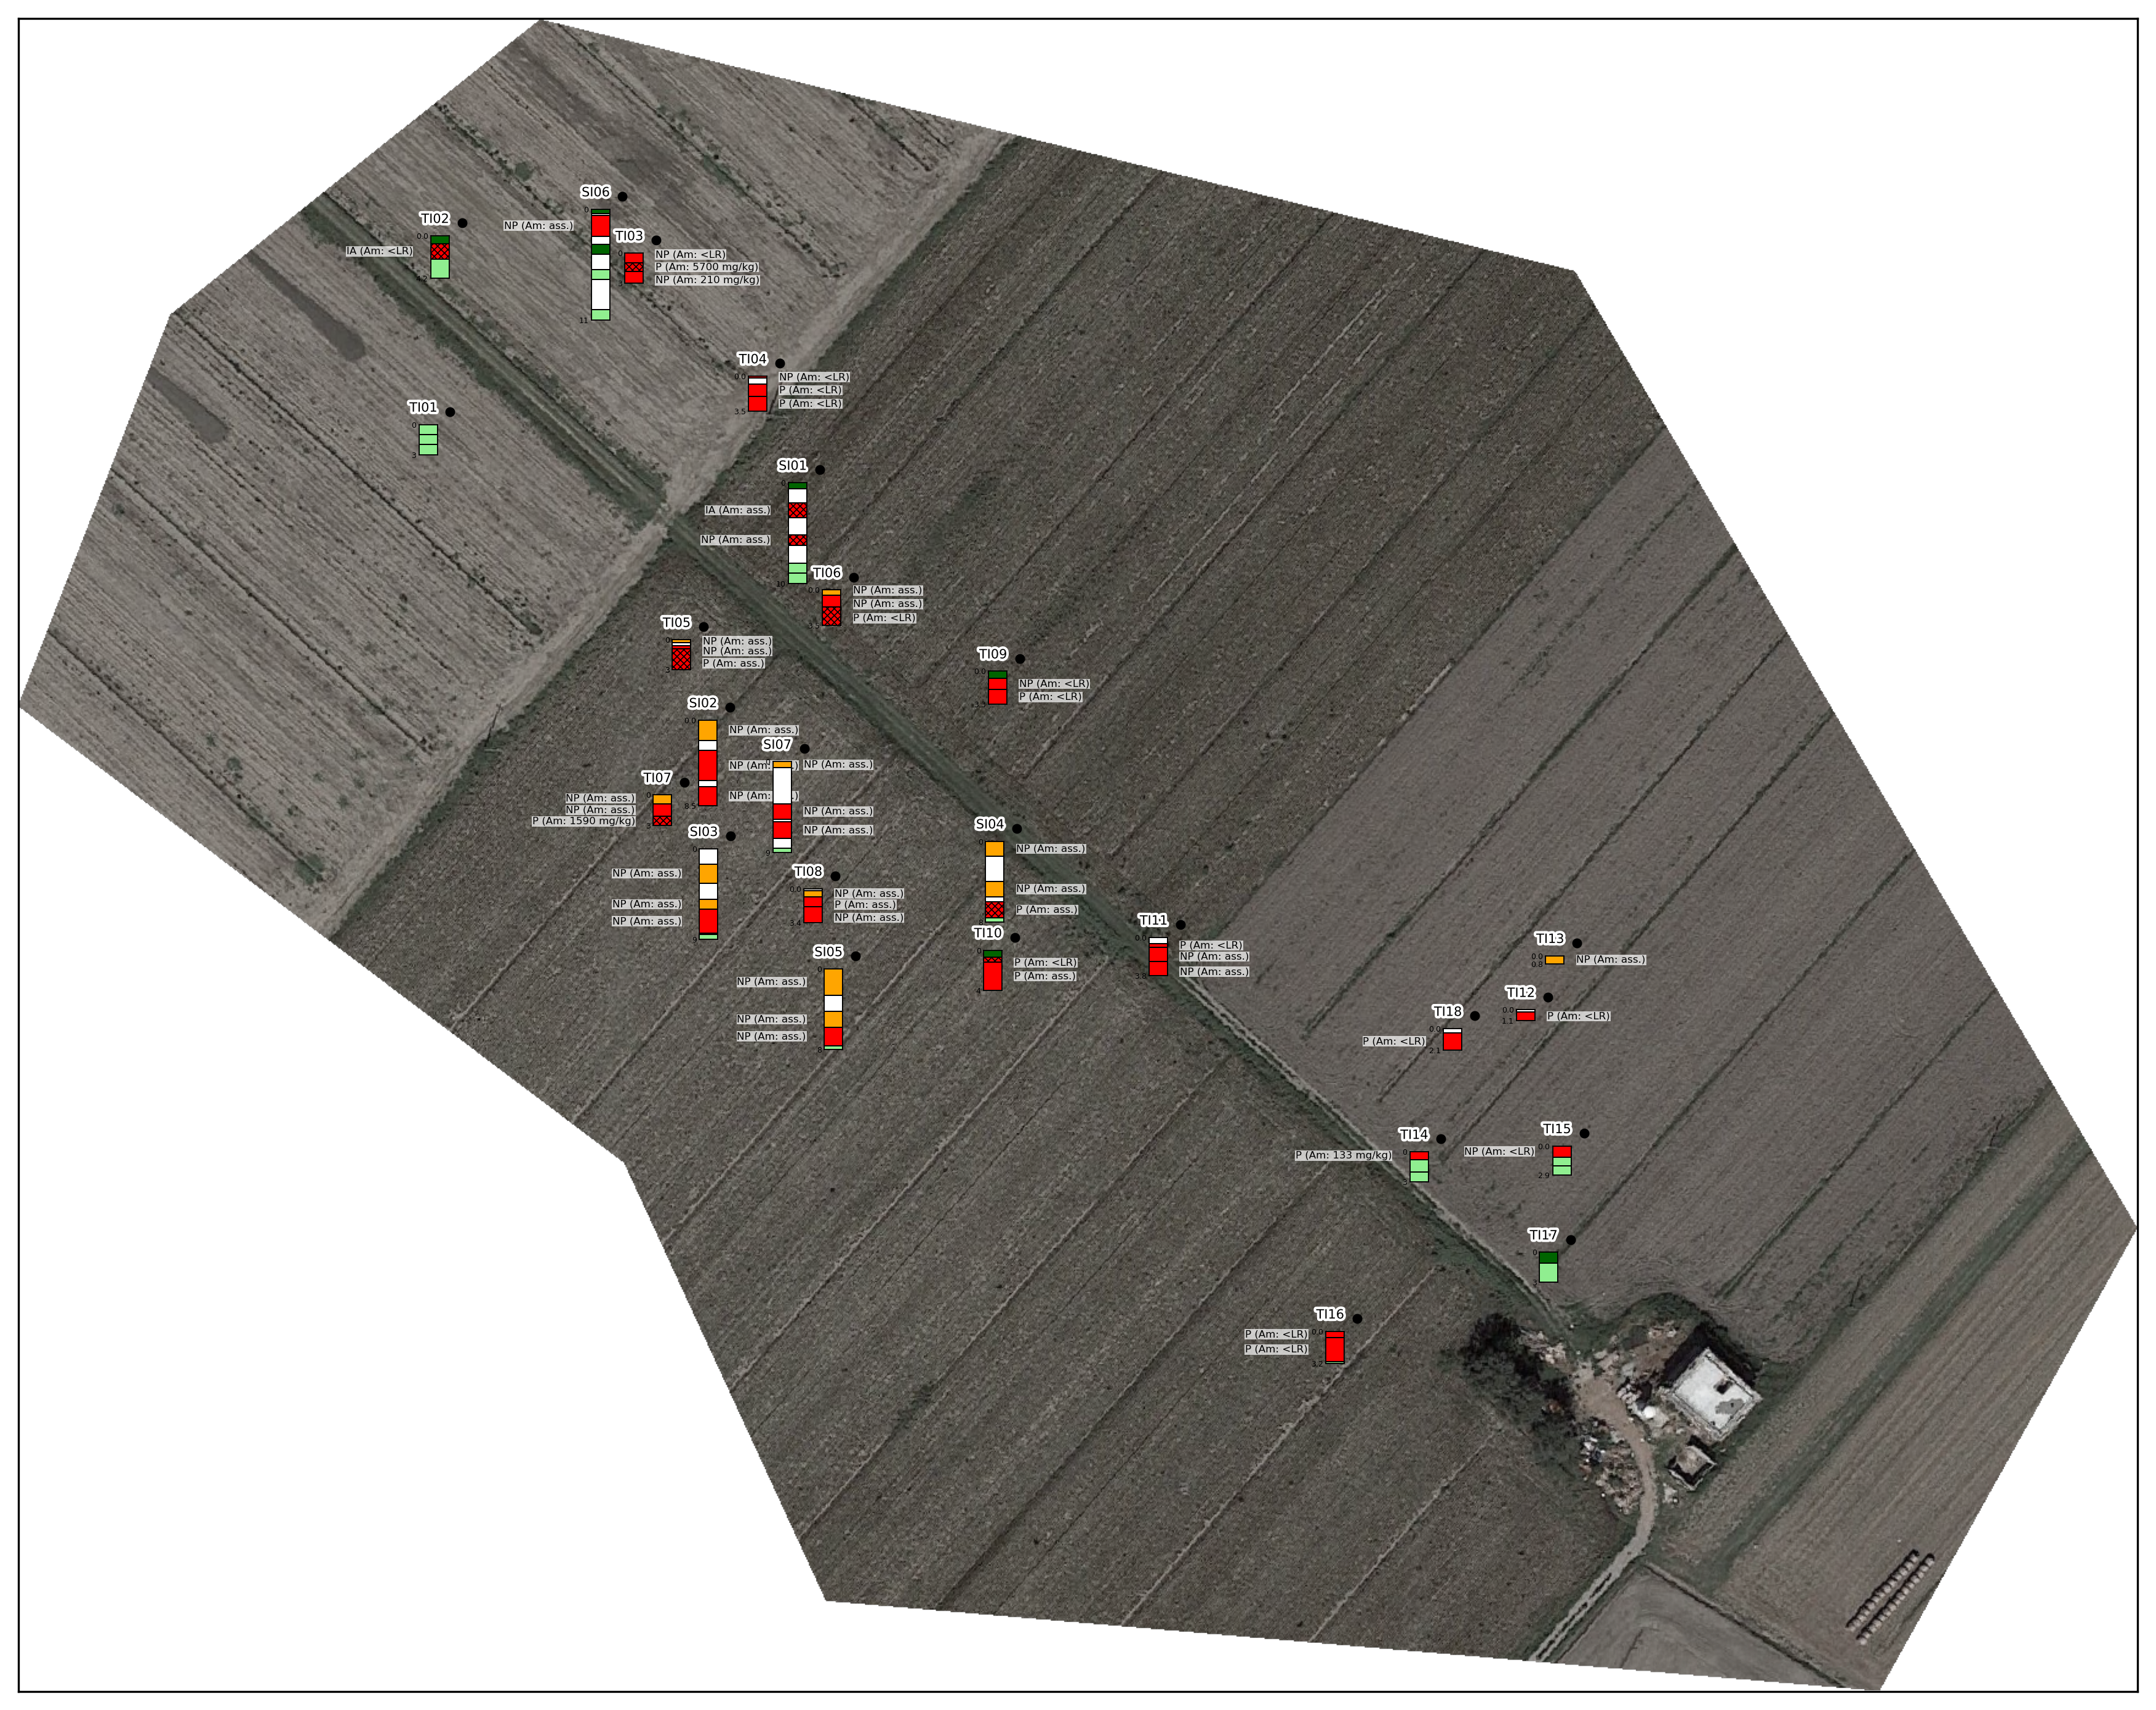
Plot and Export
By calling plot() method it is possible to plot the stratigraphic columns specified in the database.
The savefig() method allows to save the plot.
[24]:
map.plot(legend)
# map.savefig("../data/temp.pdf")