Strata objects: Legend and Column
Strata is stratigraphic data.
The main object of strata submodule is mplStrater.strata.Column which represents the single stratigraphic column. This example shows the structure of the class and how to use it.
First, import all required packages and load the example dataset.
[8]:
%load_ext autoreload
%autoreload 2
from mplStrater.data import StrataFrame
from mplStrater.strata import Column,Legend

import pandas as pd
import matplotlib.pyplot as plt
The autoreload extension is already loaded. To reload it, use:
  %reload_ext autoreload
[9]:
df=pd.read_csv("../../../data/example.csv")
df.head()
[9]:
| x | y | ID | from | to | fill | hatch | lbl1 | lbl2 | lbl3 | |
|---|---|---|---|---|---|---|---|---|---|---|
| 0 | 204026.93 | 4973197.522 | SI01 | 0.0 | 0.6 | Riporto conforme | _ | _ | _ | -1 |
| 1 | 204026.93 | 4973197.522 | SI01 | 0.6 | 2.0 | Assenza campione | _ | _ | _ | -1 |
| 2 | 204026.93 | 4973197.522 | SI01 | 2.0 | 3.5 | Rifiuto | Pericoloso | IA | non rilevato | -1 |
| 3 | 204026.93 | 4973197.522 | SI01 | 3.5 | 5.2 | Assenza campione | _ | _ | _ | -1 |
| 4 | 204026.93 | 4973197.522 | SI01 | 5.2 | 6.2 | Rifiuto | Pericoloso | NP | non rilevato | -1 |
Then, initiate a mpl.StrataFrame providing a pandas.DataFrame and specifying its epsg code.
[10]:
sf=StrataFrame(
    df=df,
    epsg=32633)
Define a Legend.
This is done providing a dictionary containing pairs of (value-specification) the fill_dict parameter and for the hatch_fill parameter.
The dictionary matches dataframe fill and hatch column values to either a matplotlib encoded color or encoded hatch string.
The example uses the following dictionaries.
[11]:
fill_dict={
    'Terreno conforme': 'lightgreen',
    'Riporto conforme': 'darkgreen',
    'Riporto non conforme': 'orange',
    'Rifiuto': 'red',
    'Assenza campione': 'white'
    }

hatch_dict={
    'Non pericoloso': '',
    'Pericoloso': 'xxxxxxxxx',
    '_': ''
    }
[12]:
l=Legend(
    fill_dict=fill_dict,
    hatch_dict=hatch_dict
)
Plot stand-alone Column objects
Imagine we would need to inspect closely a column. It’s not sure that we would be able to clearly do it on the map with all other elements (labels, basemap…). Unless exporting the map in pdf with a high resolution, open the local file… would take sooo long! Therefore Column object has its own plot() method.
Let’s plot the first three columns of the strataframe.
[13]:
sf.strataframe[:3]
[13]:
| ID | x | y | fill_list | layers | hatch_list | lbl1_list | lbl2_list | lbl3_list | scale | geometry | |
|---|---|---|---|---|---|---|---|---|---|---|---|
| 0 | SI01 | 204026.930 | 4973197.522 | [Riporto conforme, Assenza campione, Rifiuto, ... | [0.0, 0.6, 2.0, 3.5, 5.2, 6.2, 8.0, 9.0, 10.0] | [_, _, Pericoloso, _, Pericoloso, _, _, _, _] | [_, _, IA, _, NP, _, _, _, _] | [_, _, non rilevato, _, non rilevato, _, _, _, _] | [-1, -1, -1, -1, -1, -1, -1, -1, -1] | 10.0 | POINT (204026.930 4973197.522) |
| 1 | SI02 | 204008.591 | 4973148.940 | [Riporto non conforme, Assenza campione, Rifiu... | [0.0, 2.0, 3.0, 6.0, 6.6, 8.5] | [Non pericoloso, _, Non pericoloso, _, Non per... | [NP, _, NP, _, NP, NP] | [non rilevato, _, non rilevato, _, non rilevat... | [-1, -1, -1, -1, -1, -1] | 8.5 | POINT (204008.591 4973148.940) |
| 2 | SI03 | 204008.734 | 4973122.605 | [Assenza campione, Riporto non conforme, Assen... | [0.0, 1.5, 3.4, 5.0, 6.0, 8.4, 8.5, 9.0] | [_, Non pericoloso, _, Non pericoloso, Non per... | [_, NP, _, NP, NP, _, _, _] | [_, non rilevato, _, non rilevato, non rilevat... | [-1, -1, -1, -1, -1, -1, -1, -1] | 9.0 | POINT (204008.734 4973122.605) |
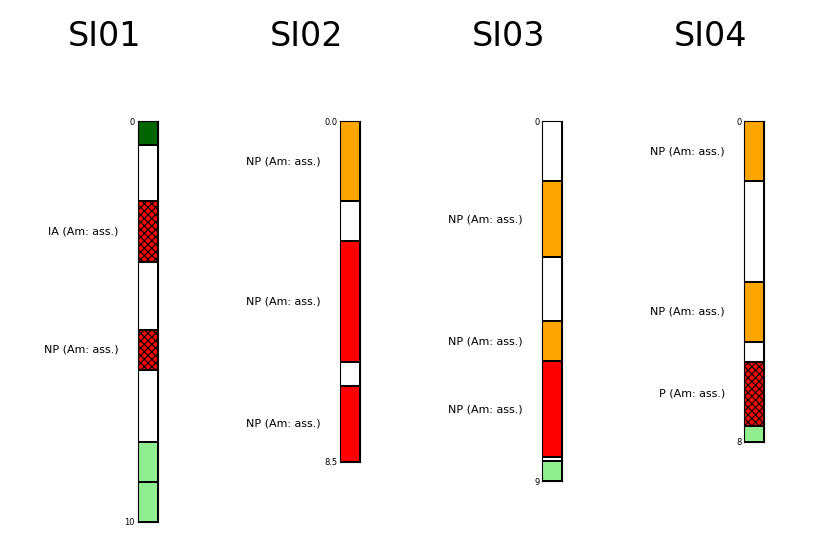
Plot the first three columns contained in the StrataFrame.
[14]:
#create figure
f,axes=plt.subplots(1,4,figsize=(5,3),dpi=200,frameon=False)
for ax,i in zip(axes,range(4)):
    ax.axis('off')
    #instantiate class
    c=Column(
        #figure
        ax,l,
        #id
        sf.strataframe.loc[i,"ID"],
        #coords
        (0.9,0.9),
        #scale
        sf.strataframe.loc[i,"scale"],
        3,
        #stratigraphic data
        sf.strataframe.loc[i,"layers"],
        sf.strataframe.loc[i,"fill_list"],
        sf.strataframe.loc[i,"hatch_list"],
        #labels
        sf.strataframe.loc[i,"lbl1_list"],
        sf.strataframe.loc[i,"lbl2_list"],
        sf.strataframe.loc[i,"lbl3_list"])
    ax.set_title(c.id)
    c.fill_column()
    c.set_inset_params()
    c.label_column(hardcoding=None)