Quick start
[1]:
import py3dinterpolations as p3i
import pandas as pd
GridData: core object optimized for grid data.
The GridData object is the core object of the package. It is optimized for grid data, i.e. data that are defined on a grid (ie. X,Y,Z coordinates).
GridData is optimized to handle large data sets. It is based on the pandas package and uses pandas.DataFrame as the underlying data structure.
Column names could be either default [“X”, “Y”, “Z”,”V”] or custom. In the latter case, the user must specify the column names in the function call.
[2]:
df = pd.read_csv(
    "../../../tests/fixtures/griddata_default_colnames.csv"
)
df.tail()
[2]:
| ID | X | Y | Z | V | |
|---|---|---|---|---|---|
| 278 | ID00 | 15.194 | 0.0 | 12.0 | 9.047969 |
| 279 | ID00 | 15.194 | 0.0 | 10.0 | 10.077271 |
| 280 | ID00 | 15.194 | 0.0 | 8.0 | 20.082454 |
| 281 | ID00 | 15.194 | 0.0 | 6.0 | 19.042223 |
| 282 | ID00 | 15.194 | 0.0 | 4.0 | 12.889411 |
[3]:
gd = p3i.GridData(df)
gd.data
[3]:
| V | ||||
|---|---|---|---|---|
| ID | X | Y | Z | |
| ID30 | 62.163 | 14.336 | 20.0 | 7.523950 |
| 18.0 | 7.504403 | |||
| 16.0 | 12.431670 | |||
| 14.0 | 12.653931 | |||
| 12.0 | 17.956143 | |||
| ... | ... | ... | ... | ... |
| ID00 | 15.194 | 0.000 | 12.0 | 9.047969 |
| 10.0 | 10.077271 | |||
| 8.0 | 20.082454 | |||
| 6.0 | 19.042223 | |||
| 4.0 | 12.889411 |
283 rows × 1 columns
Interpolate
Interpolate by calling the interpolate method, that:
Calulcates required 3d grid for prediction
Executes preprocessing
Fit the model
Executes interpolation
The method by defaults returns only the a np.ndarray with the interpolated values. Optionally the model object can be returned as well, using the return_model argument.
[4]:
interpolated, model = p3i.interpolate(
    gd,
    model_name = "ordinary_kriging",
    model_params = {
        "variogram_model": "spherical",
        "nlags": 15,
        "weight": True,
        "exact_values": False,
        "verbose": True,
        "enable_plotting": True,
    },
    grid_resolution=5,
    preprocess_kwags={
        "normalize_xyz": True,
        "standardize_v": True,
    },
    return_model=True, # get all components, not only the resulting interpolated grid
)
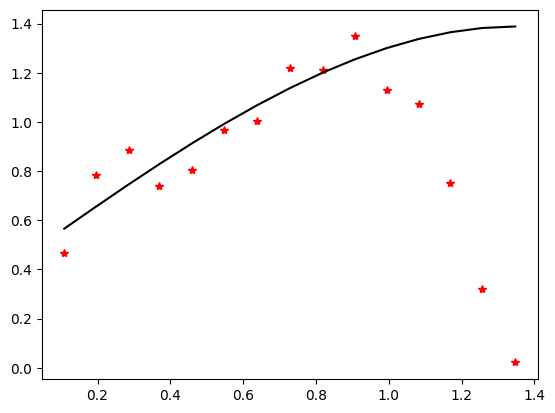
Plotting Enabled

Adjusting data for anisotropy...
Initializing variogram model...
Using 'spherical' Variogram Model
Partial Sill: 0.9354345660967028
Full Sill: 1.3881780379488828
Range: 1.3471914574752943
Nugget: 0.45274347185218

Calculating statistics on variogram model fit...
Q1 = 0.07837620908121956
Q2 = 1.008397764148196
cR = 0.679391581672394

Executing Ordinary Kriging...
Visualization with Plotly and Matplotlib
The package natively supports matplotlib and plotly for visualization.
Plotly is preferred for 3D interactive visualization, while matplotlib is preferred for 2D visualization.
Both methods features the possibility to plot the data points as well as the interpolated surface/volume.
[5]:
%matplotlib inline
fig2 = p3i.plot_2d_model(
    model,
    axis="Z",
    plot_points=True,
    annotate_points=True,
)
---------------------------------------------------------------------------
AttributeError                            Traceback (most recent call last)
File /opt/hostedtoolcache/Python/3.10.12/x64/lib/python3.10/site-packages/IPython/core/formatters.py:340, in BaseFormatter.__call__(self, obj)
    338     pass
    339 else:
--> 340     return printer(obj)
    341 # Finally look for special method names
    342 method = get_real_method(obj, self.print_method)

File /opt/hostedtoolcache/Python/3.10.12/x64/lib/python3.10/site-packages/IPython/core/pylabtools.py:152, in print_figure(fig, fmt, bbox_inches, base64, **kwargs)
    149     from matplotlib.backend_bases import FigureCanvasBase
    150     FigureCanvasBase(fig)
--> 152 fig.canvas.print_figure(bytes_io, **kw)
    153 data = bytes_io.getvalue()
    154 if fmt == 'svg':

File /opt/hostedtoolcache/Python/3.10.12/x64/lib/python3.10/site-packages/matplotlib/backend_bases.py:2353, in FigureCanvasBase.print_figure(self, filename, dpi, facecolor, edgecolor, orientation, format, bbox_inches, pad_inches, bbox_extra_artists, backend, **kwargs)
   2350         bbox_inches = bbox_inches.padded(pad_inches)
   2352     # call adjust_bbox to save only the given area
-> 2353     restore_bbox = _tight_bbox.adjust_bbox(
   2354         self.figure, bbox_inches, self.figure.canvas.fixed_dpi)
   2356     _bbox_inches_restore = (bbox_inches, restore_bbox)
   2357 else:

File /opt/hostedtoolcache/Python/3.10.12/x64/lib/python3.10/site-packages/matplotlib/_tight_bbox.py:28, in adjust_bbox(fig, bbox_inches, fixed_dpi)
     26 locator = ax.get_axes_locator()
     27 if locator is not None:
---> 28     ax.apply_aspect(locator(ax, None))
     29 locator_list.append(locator)
     30 current_pos = ax.get_position(original=False).frozen()

File /opt/hostedtoolcache/Python/3.10.12/x64/lib/python3.10/site-packages/matplotlib/colorbar.py:156, in _ColorbarAxesLocator.__call__(self, ax, renderer)
    154 def __call__(self, ax, renderer):
    155     if self._orig_locator is not None:
--> 156         pos = self._orig_locator(ax, renderer)
    157     else:
    158         pos = ax.get_position(original=True)

File /opt/hostedtoolcache/Python/3.10.12/x64/lib/python3.10/site-packages/mpl_toolkits/axes_grid1/inset_locator.py:73, in AnchoredLocatorBase.__call__(self, ax, renderer)
     71 def __call__(self, ax, renderer):
     72     self.axes = ax
---> 73     bbox = self.get_window_extent(renderer)
     74     px, py = self.get_offset(bbox.width, bbox.height, 0, 0, renderer)
     75     bbox_canvas = Bbox.from_bounds(px, py, bbox.width, bbox.height)

File /opt/hostedtoolcache/Python/3.10.12/x64/lib/python3.10/site-packages/matplotlib/offsetbox.py:399, in OffsetBox.get_window_extent(self, renderer)
    396 def get_window_extent(self, renderer=None):
    397     # docstring inherited
    398     if renderer is None:
--> 399         renderer = self.figure._get_renderer()
    400     bbox = self.get_bbox(renderer)
    401     try:  # Some subclasses redefine get_offset to take no args.

AttributeError: 'NoneType' object has no attribute '_get_renderer'
<Figure size 2400x3000 with 6 Axes>
[6]:
import plotly.io as pio
# This ensures Plotly output works in multiple places:
# plotly_mimetype: VS Code notebook UI
# notebook: "Jupyter: Export to HTML" command in VS Code
# See https://plotly.com/python/renderers/#multiple-renderers
pio.renderers.default = "plotly_mimetype+notebook"
[7]:
fig = p3i.plot_3d_model(
    model,
    plot_points=True,
    scale_points=10,
    volume_kwargs={
        "surface_count": 10,
    }
)
fig.show()